The key difference between polarography and voltammetry is that the polarography is a type of voltammetry that uses a liquid metal electrode whereas the voltammetry is an analytical technique in which the potential is varied regularly while the current is monitored.
Voltammetry is an electroanalytical method which has applications in analytical chemistry and in various industrial processes. Polarography is a type of voltammetry.
CONTENTS
1. Overview and Key Difference
2. What is Polarography
3. What is Voltammetry
4. Side by Side Comparison – Polarography vs Voltammetry in Tabular Form
5. Summary
What is Polarography?
Polarography is a type of voltammetry in which the working electrode is a liquid metal. In other words, the working electrode in polarography is dropping mercury electrode (DME) or a static mercury drop electrode. These electrodes are useful for their wide cathodic ranges and renewable surfaces. Polarography was invented in 1922 by a chemist named Jaroslav Heyrovsky. He also got Nobel prize for this invention in 1959.

Figure 01: An Old Polarography
Moreover, the measurement in polarography is a response that is only determined by diffusion mass transport. Polarography simply involves the study of solutions of electrode processes by means of electrolysis using two electrodes. One of the electrodes is polarizable while the other electrode is unpolarizable. The polarizable electrode is a dropping mercury electrode.
The category to which the polarography falls is the general category of linear-sweep voltammetry in which the electrode potential is altered in a linear fashion from the initial potential to the final potential. Due to the effect of having linear sweep methods that are controlled by diffusion mass transport, polarographic experiments have sigmoidal shapes.
What is Voltammetry?
Voltammetry is an analytical technique in which the properties of an analyte are determined by measuring the current as the potential is varied. It is important in analytical chemistry and in various industrial processes.
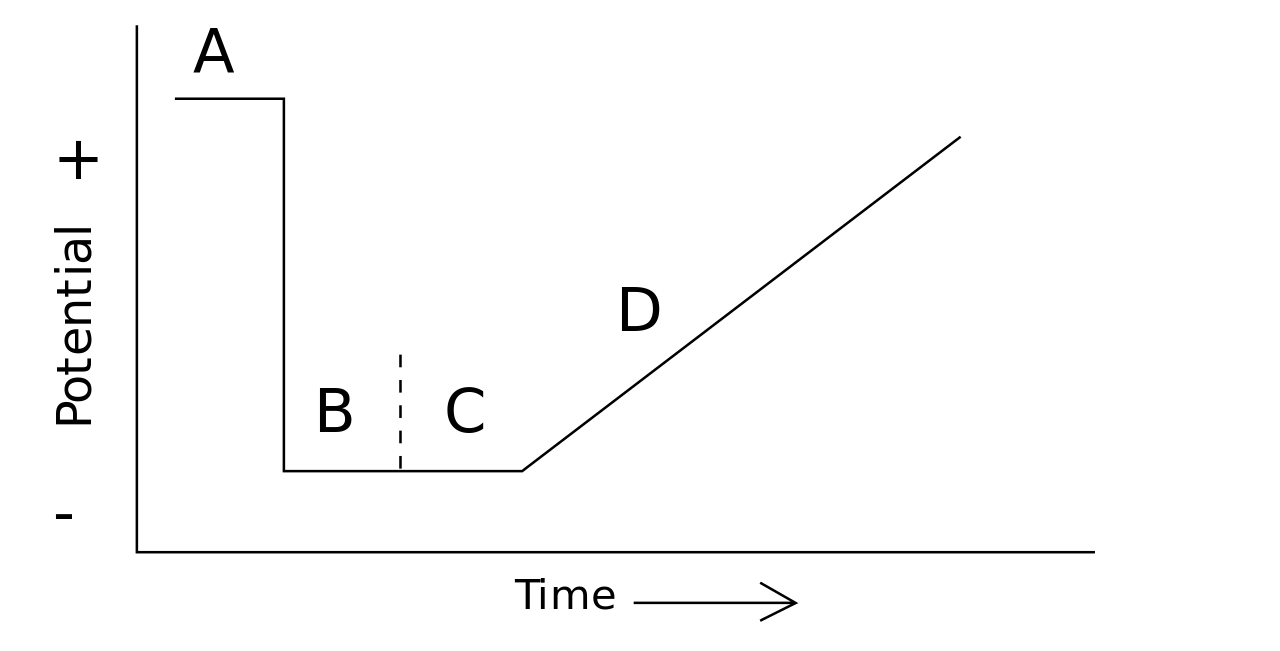
In voltammetry, we investigate the half-cell reactivity of an analyte. Moreover, it is the study of current as a function of applied potential. The curve that we get from the voltammetric analysis is named voltammogram. It shows the variation of potential with time. Here, the potential varies arbitrarily either step by step or as a continuous process. And, we can measure the actual current value as the dependent variable. Furthermore, the process opposite to voltammetry is amperometry.

Figure 02: An Example of a Voltammogram
To conduct an experiment in voltammetry, we need at least two electrodes. Of the two, one electrode is called the working electrode. It makes contact with the analyte. The working electrode must apply the desired potential in a controlled manner to facilitate the transfer of charge to and from the analyte. The second electrode, on the other hand, should have a known potential which can gauge the potential of the working electrode.
What is the Difference Between Polarography and Voltammetry?
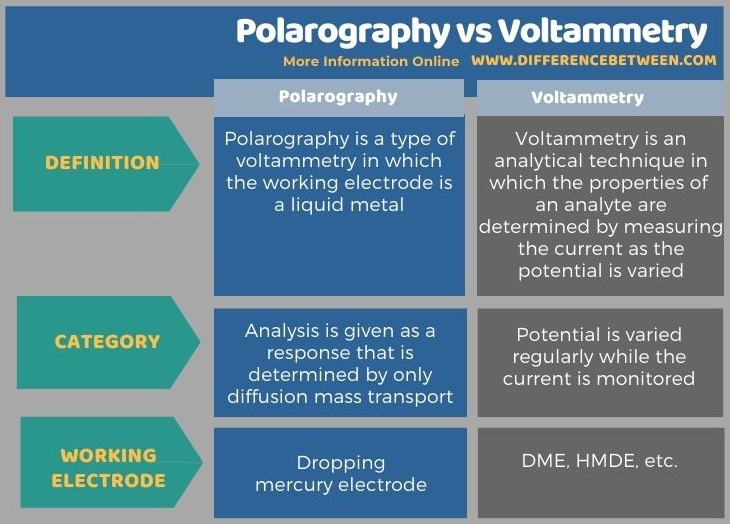
The key difference between polarography and voltammetry is that the polarography is a type of voltammetry that uses a liquid metal electrode whereas the voltammetry is an analytical technique in which the potential is varied regularly while the current is monitored. Polarography is a subclass of voltammetry.
The following infographic summarizes the difference between polarography and voltammetry.

Summary – Polarography vs Voltammetry
In brief, the polarography is a subclass of voltammetry. The key difference between polarography and voltammetry is that the polarography is a type of voltammetry that uses a liquid metal electrode whereas the voltammetry is an analytical technique in which the potential is varied regularly while the current is monitored.
Reference:
1. “Polarography.” Encyclopædia Britannica, Encyclopædia Britannica, Inc., 22 Jan. 2018, Available here.
Image Courtesy:
1. “Heyrovského polarograf 1” By Lukáš Mižoch – Own work (CC BY-SA 3.0) via Commons Wikimedia
2. By Lcolson – Linear Potential Sweep Anodic Stripping Voltammetry.JPG (CC0) via Commons Wikimedia
ncG1vNJzZmivp6x7pbXFn5yrnZ6YsqOx07CcnqZemLyue8OinZ%2Bdopq7pLGMm5ytr5Wau268zqWYq6eXp66xtNhmmKecXau8rcDApqSerKKufA%3D%3D