Key Difference – Comparative vs Ratio Analysis
Information is compared by companies in different forms in order to understand current performance and plan for future performance. Comparative and ratio analysis are two methods that provide information about a company. The key difference between Comparative and Ratio Analysis is that comparative analysis compares comparative information between companies and times whereas ratio analysis is a way of using information in company’s financial statements to assess the profitability, activity, liquidity and solvency.
CONTENTS
1. Overview and Key Difference
2. What is Comparative Analysis
3. What is Ratio Analysis
4. Side by Side Comparison – Comparative vs Ratio Analysis
What is Comparative Analysis?
In a comparative analysis, the information on financial statements of a company is compared with that of previous years or with other similar companies.
Comparison with previous years
It is vital for a business to grow continuously. To be able to identify whether this has happened and how it has happened, the information of previous accounting period should be compared with the current period. Many companies provide the results of the last financial year in a column next to the current year’s results for the ease of comparison. Financial statements of public companies are easy to compare since their preparation follows a standard format.
E.g.
Income statement of ABC Ltd for the year ending 31.12.2016 | ||
| 2016 (‘000) | 2015 (‘000) | |
| Sales | 520 | 488 |
| Cost of sales | (375) | (370) |
| Gross profit | 145 | 118 |
By looking at the above table, users of the statement can clearly see that the gross profit has increased from 2015 to 2016.
Comparison with other companies
This is referred to as ‘benchmarking’. Comparing financial information with companies in the same industry gives rise to many benefits. These similar companies are often competitors, thus how they have performed relative to the company can be analysed using benchmarking. The results of this exercise are more effective when companies of similar size and similar product are compared.
E.g. Coca-Cola and Pepsi, Boeing and Airbus

What is Ratio Analysis
Ratio analysis is a very important technique used to analyse the financial information. Usually, ratio analysis is conducted at the end of the financial accounting period. The quantities in year-end financial statements are used to calculate ratios. Year-end financial statement provides information regarding the results that were achieved during the year and the current status of the company by providing the amounts of assets, liabilities and equity it holds. While useful, these are mainly prepared for the presentation and regulatory purposes and have little value in understanding what this information means and how they can be utilised in making decisions for the future. These limitations are addressed through Ratio Analysis.
Continuing from the above example,
E.g. Gross margin ratio (Sales/Gross profit) can be used to calculate by how much the gross profit has increased from 2015. The Gross margin for 2015 is 24% and has increased to 28% in 2016.
It provides an interpretation of the ratios calculated, and depending on whether the result is positive or negative, the management can decide what actions to be taken for the betterment of the future.
E.g. The debt to equity ratio is a reflection of the financing structure of the company and reflects the amount of debt as a portion of equity. This should be maintained at a certain level; if the ratio is too high, it indicates that the company is primarily financed through debt, which is highly risky. On the other hand, equity financing is costly than debt financing as interest paid on debt is tax deductible. Thus, depending on the ratio, management can decide what the future financing structure should be.
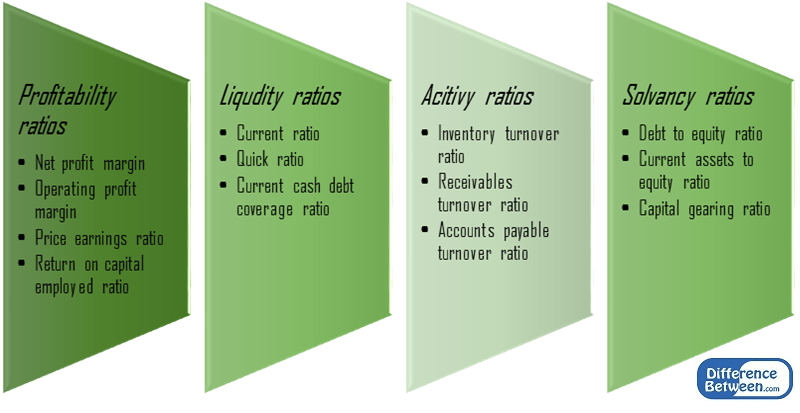
There are 4 main categories of ratios, and a number of ratios are calculated for each category. Some of the most common ratios are as follows.

Figure 1: Common Financial Ratios
Ratio analysis is also a type of comparative analysis since ratios are often compared with past ratios and ratios with similar companies. Unlike in comparative analysis where the information is compared in absolute terms, ratio analysis helps to compare in relative terms; thus the size of the company does not pose a problem in the analysis. However, the calculation of ratios is based on post information and sometimes shareholders are more concerned with receiving forecasts about the future.
What is the difference between Comparative and Ratio Analysis?
Comparative vs Ratio Analysis | |
| Comparative analysis is mainly used to compare information with prior accounting period and other companies. | Ratio analysis is mainly used to interpret financial information and make future decisions. |
| Nature | |
| This can be quantitative and qualitative. | This is quantitative in nature. |
| Size of the Company | |
| Companies of different sizes cannot be compared | Companies of different sizes can be compared |
Reference:
“Importance And Advantages Of Ratio Analysis.” Importance and Advantages Of Ratio Analysis. N.p., n.d. Web. 03 Feb. 2017.
Supporter. “Advantages of Ratio Analysis.” Accounting Education. N.p., 06 Dec. 2011. Web. 03 Feb. 2017.
Written by Obaidullah Jan, ACA, CFA. “Advantages and Limitations of Ratio Analysis.” Advantages and Limitations of Financial Ratio Analysis. N.p., n.d. Web. 03 Feb. 2017.
“Classification of financial ratios.” Accounting For Management RSS. N.p., n.d. Web. 03 Feb. 2017.
Image Courtesy: Pixabay
ncG1vNJzZmivp6x7pbXFn5yrnZ6YsqOx07CcnqZemLyue8OinZ%2Bdopq7pLGMm5ytr5Wau26vzqanmqqRqba3sYyapZ1lpqh6s63ToqZmmZ6Wubq%2FyKxm